
Hi! This blog post is about the progress we've made at DataLoom over the past month and a half. We are now halfway through Google Summer of Code, and I'm happy to say that I've successfully passed my mid-term evaluations. Yay!
Here is a summary of the work we've done, the architectural decisions we've taken, and the new features we've built.
Features Added
1. User-owned Datasets/Projects and Authentication
The first major feature was user-owned datasets.
Earlier, there was no user-based authentication. Projects did not have owners, so there was no way to differentiate one user's work from another's. This was one of the first things I noticed when I initially explored the project during the Community Bonding period, while trying to get a lay of the land.
The approach we chose for authentication and authorization was intentionally simple. At the current stage of the project, there is no role-based access control (RBAC), no administrators, and no project sharing. The only requirement was to allow users to sign in and access their own projects.
Authentication was implemented using JWT-based authentication. When a user signs in, an authentication cookie is stored in the browser. Signing out clears the cookie. User passwords are securely hashed during sign-up, and all the standard security measures have been implemented.
That covers authentication for now.
2. Multiple File Format Support
DataLoom initially supported only CSV files.
One of our early goals was to add support for multiple file formats while the project was still relatively small and easier to extend. Since pandas already provides support for formats such as Excel, JSON, Parquet, and TSV, it was straightforward to allow users to import these formats and export datasets from one format to another.
One design decision that required a small compromise was handling deeply nested JSON objects.
For now, we flatten JSON only one level deep before stopping. In the long run, it would be preferable to recursively traverse the entire JSON tree, but that is an improvement that can be implemented later.
3. Refactoring the Transformation Engine
Next, we refactored the transformation engine.
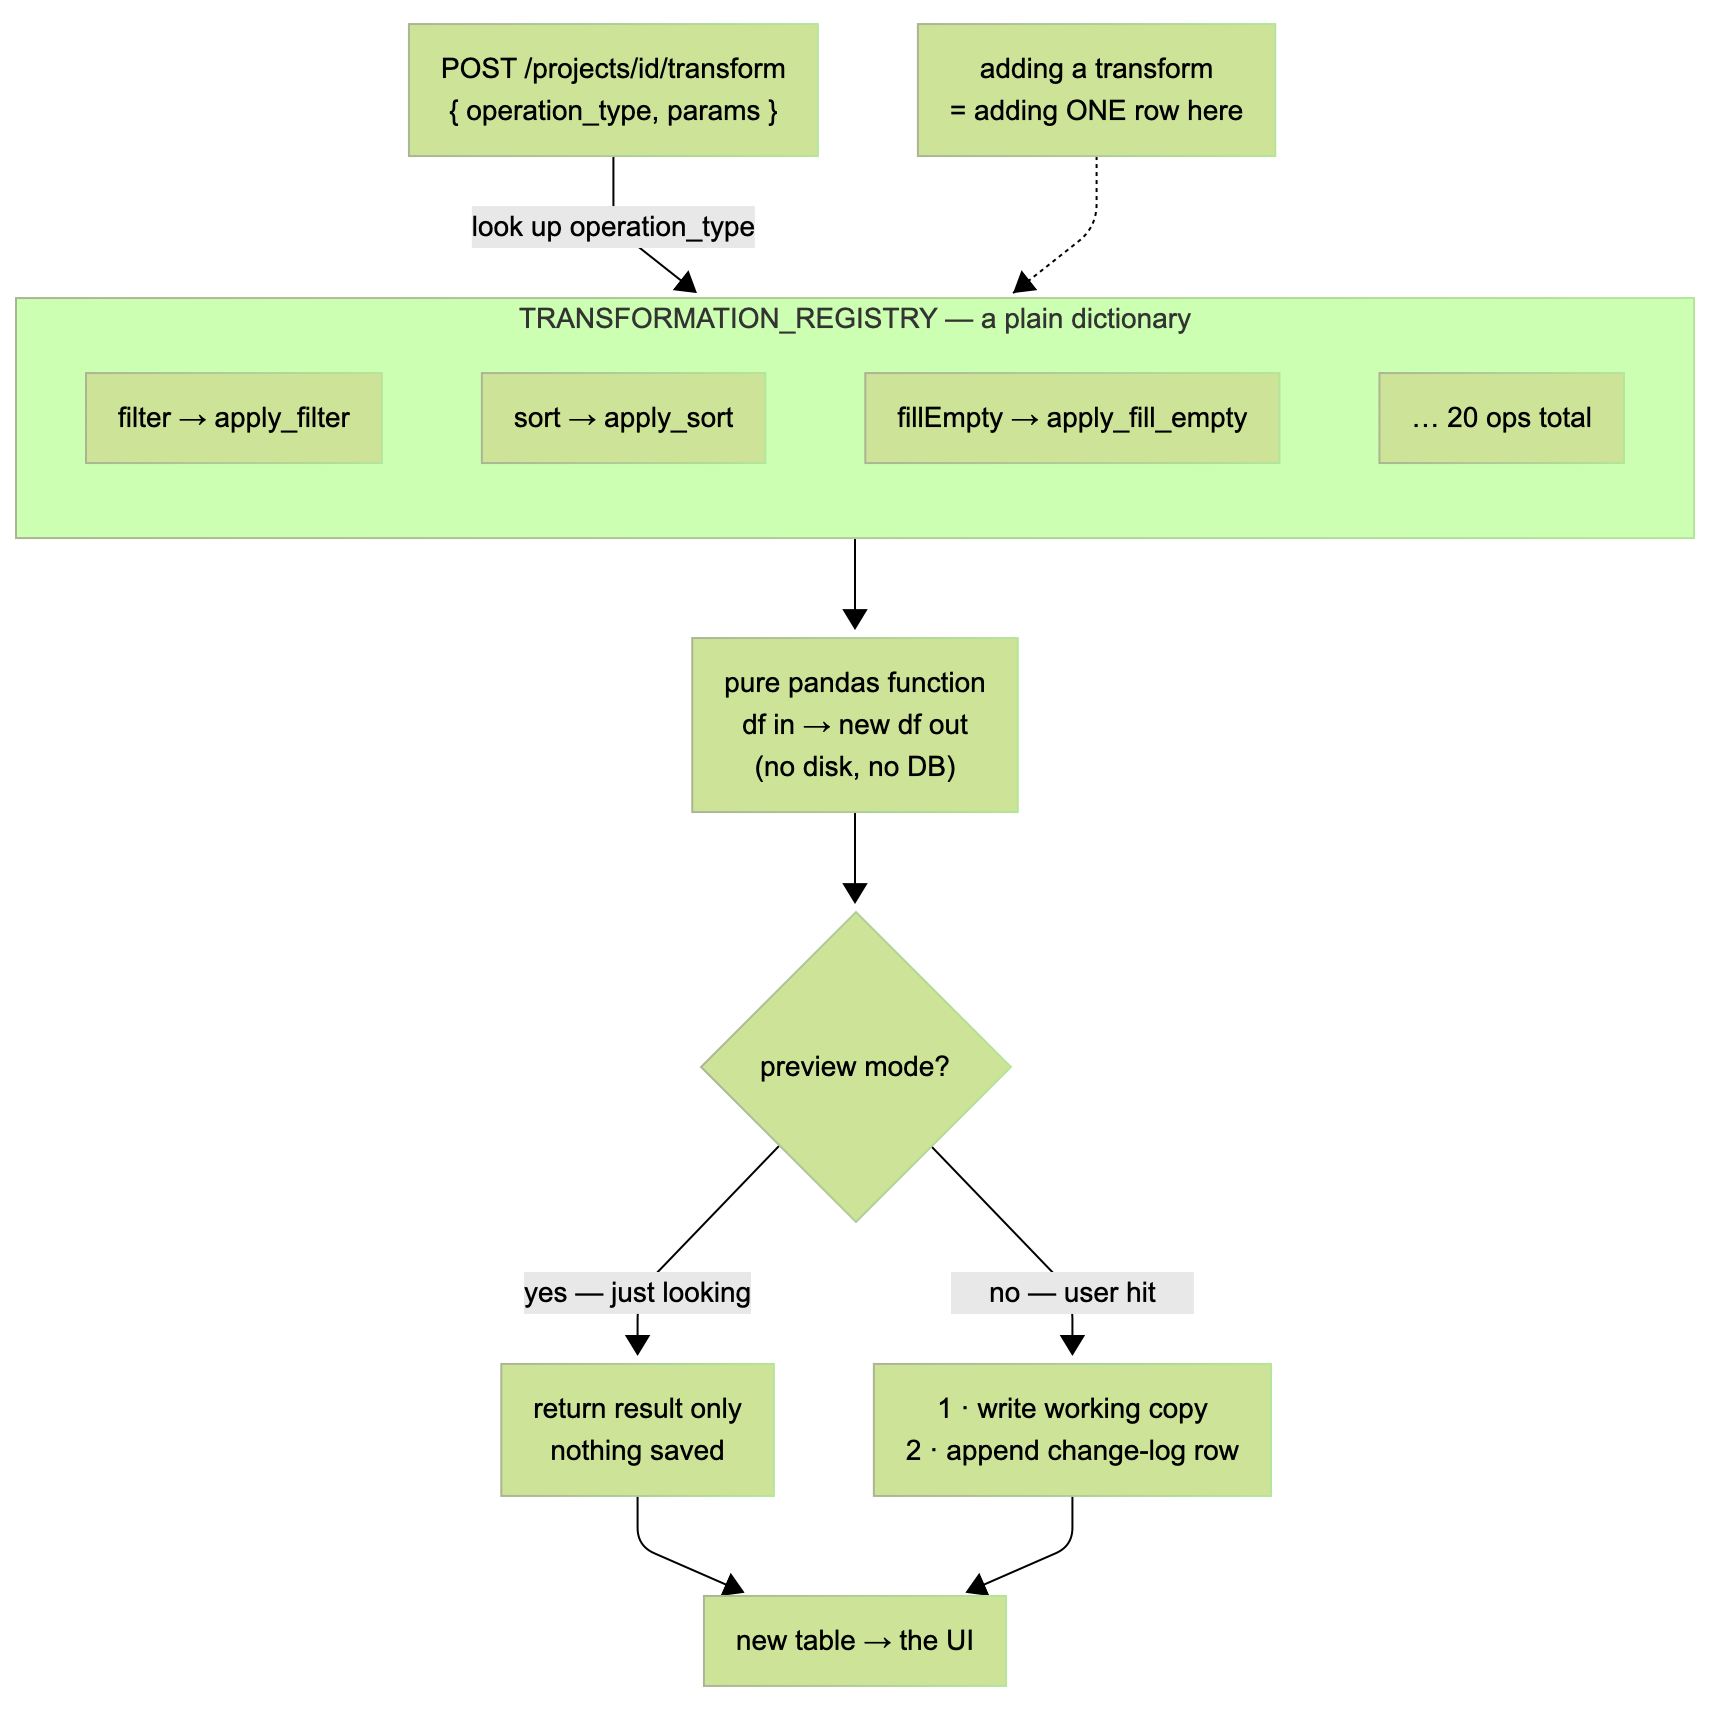
The initial implementation worked well for the handful of transformations that existed, but it wasn't particularly scalable or extensible. Adding a new transformation required making changes across multiple files, wiring everything together manually, and touching code in several places, which quickly became difficult to maintain.
So I introduced a registry/factory pattern.
Any new transformation, along with any file I/O-related functionality, can now be added by simply registering its implementation. The registry takes care of dispatching the appropriate function with the required parameters, making the entire system significantly more modular and much easier to extend.
As the number of transformations continues to grow, adding new functionality now requires editing far fewer files than before.
The diagram below illustrates the new architecture.
4. Data Profiling
One of the core capabilities of any data wrangling platform is data profiling.
Users should be able to understand their dataset before transforming it. They should be able to answer questions such as:
- How much data is missing?
- What does the overall distribution look like?
- Which values occur most frequently?
- What are the mean and median values?
- How clean is the dataset?
To support this, I added a set of commonly used profiling features to the codebase.
I took inspiration from other data wrangling tools and designed a solution where each column's statistics are displayed directly above its column header. In addition, the project includes a dedicated profiling page that provides an overall summary of the entire dataset.
5. Workspace Revamp
DataLoom's UX was not in a good state when I applied and wrote my proposal. This was one of the things I was most excited to work on.
Initially, the transformation forms and the data table were stacked vertically on top of each other. This led to a poor user experience, with the forms taking up more space than the table and users only being able to focus on one view at a time without an easy way to switch between them.
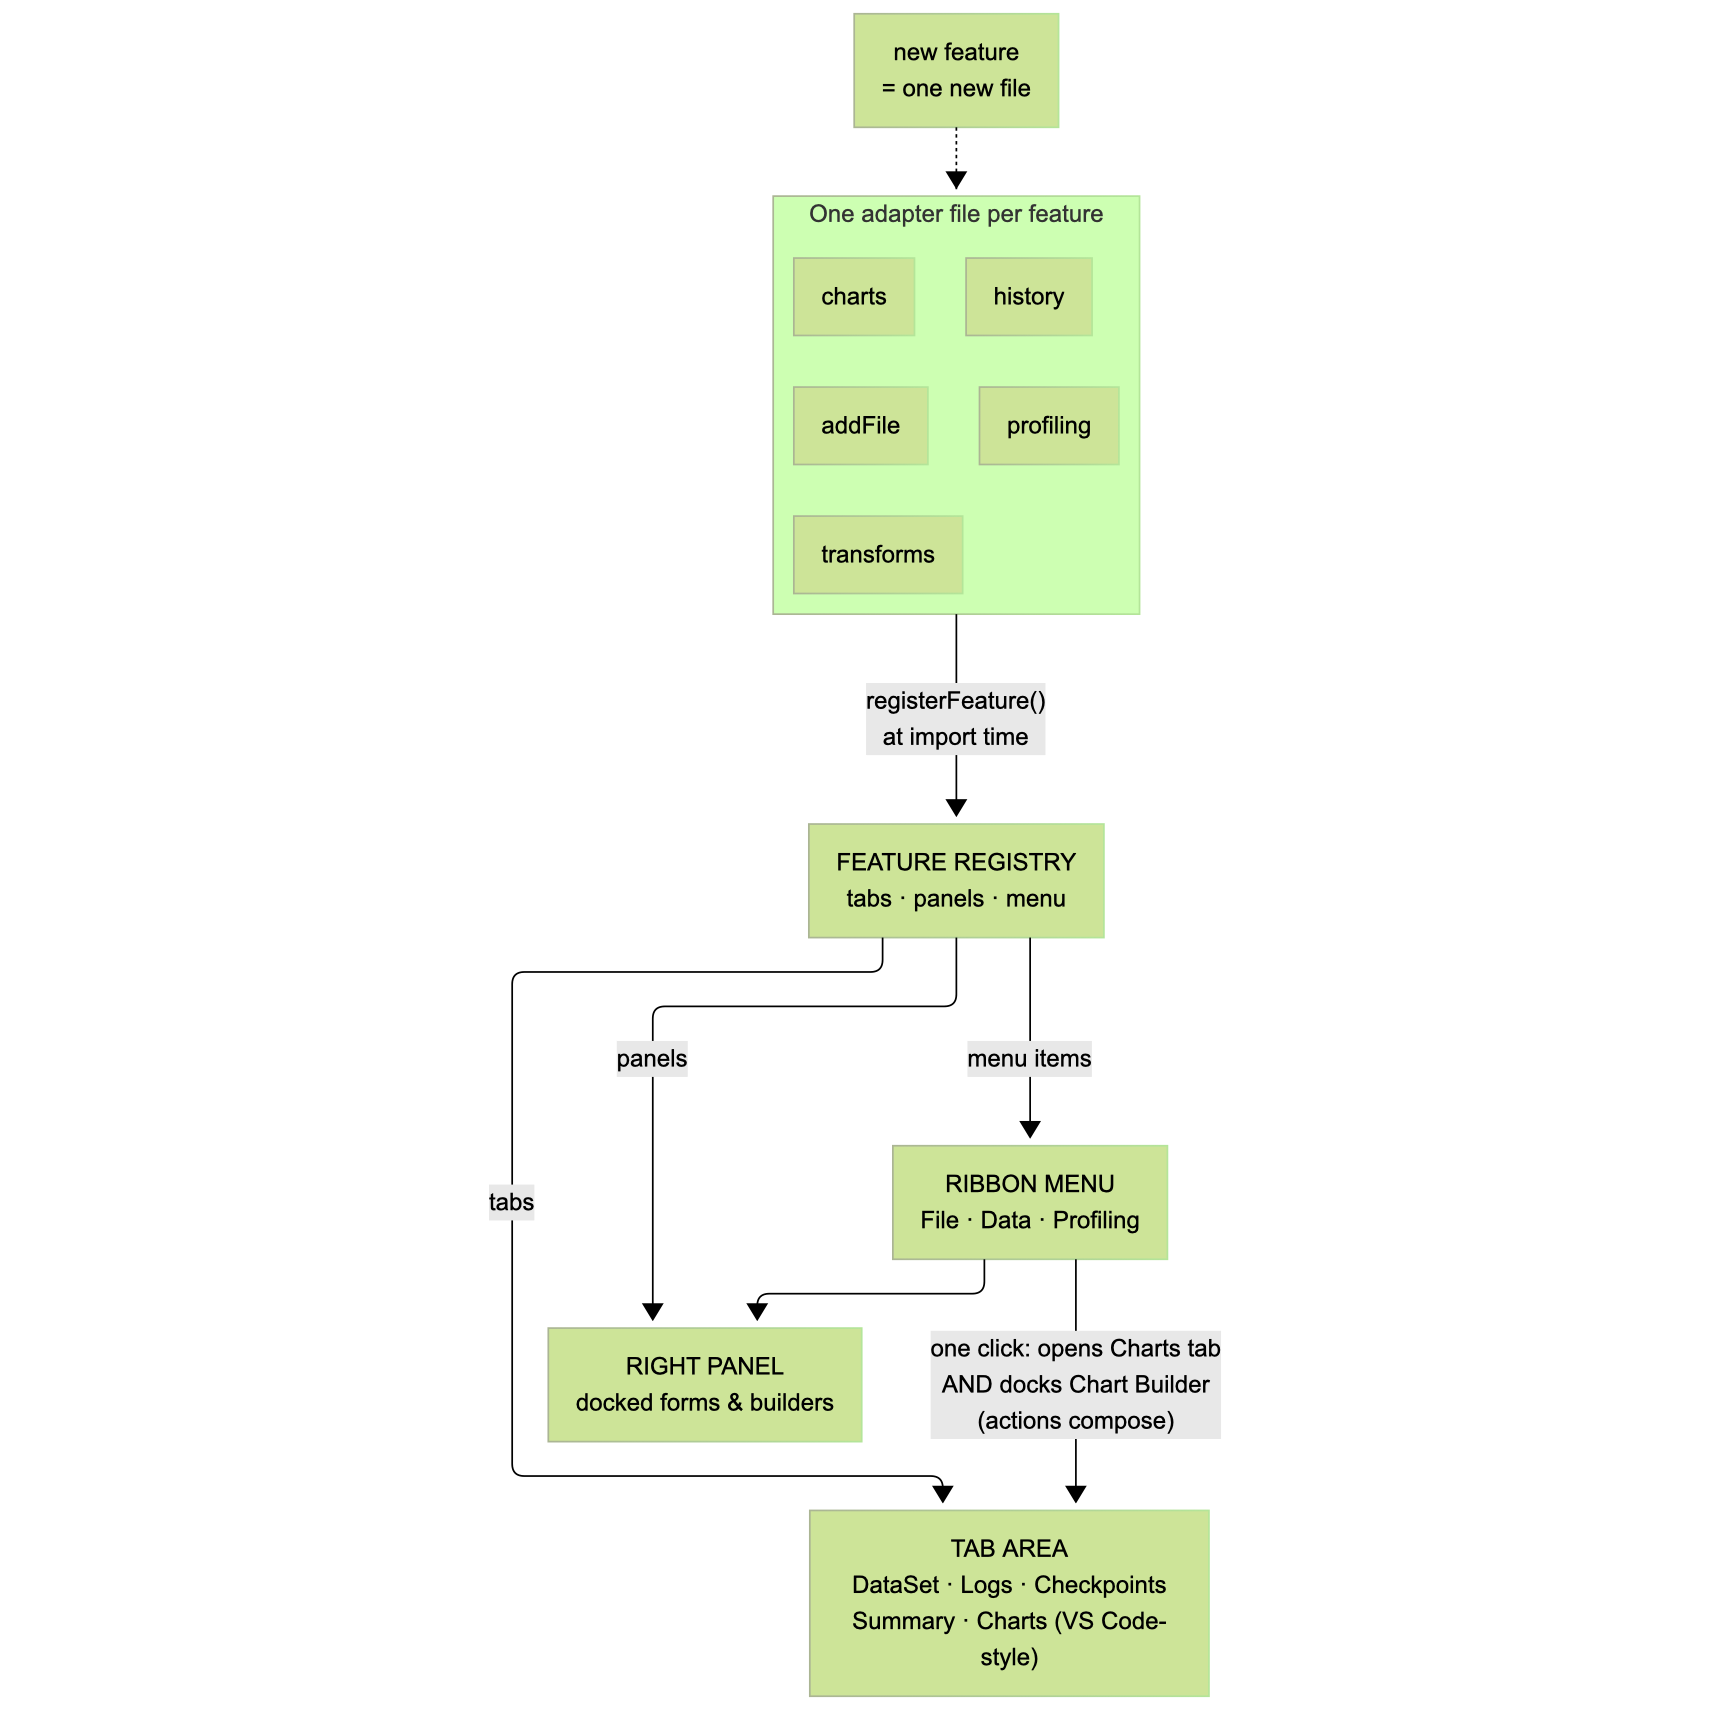
I took inspiration from tools such as VS Code, Outerbase, and Unity to come up with a cleaner workspace. The transformation forms now open in a right-side panel, while multiple views can be opened simultaneously using a tabbed interface. Similar to VS Code, each view appears in its own tab, allowing users to open, close, and switch between them easily.
One of the core architectural improvements behind this revamp was introducing a feature registry on the frontend. Any new feature that needs a sidebar can register itself with the sidebar component. Likewise, any feature that requires a new tab can register itself with the tab system. This makes the workspace highly extensible and significantly simplifies the process of adding new functionality in the future.
The diagram below explains the architecture in more detail.
6. Charts (Data Visualization)
Another feature that DataLoom lacked was the ability to visualize data through charts.
This turned out to be a fairly straightforward addition because much of the groundwork had already been laid by the feature registry. All that was needed was a set of reusable chart components that could consume the dataset and render visualizations using Recharts.
The project now supports multiple chart types, including:
- Histograms
- Pie charts
- Scatter plots
Although this was relatively simple to implement, it adds tremendous value by allowing users to better understand their data visually.
7. Multi-file Projects
DataLoom originally supported only a single file per project.
This quickly became a limitation because users could not add another dataset to an existing project. Instead, they had to create an entirely new project, even if they simply wanted to combine related datasets.
To address this, I added support for multi-file projects.
Users can now add additional files to an existing project. Each uploaded file is stored separately, while the original dataset remains untouched. The project's working copy is then created by merging the datasets using pandas, allowing users to analyze multiple datasets together within the same project.
A natural extension of this feature would be supporting joins between datasets, enabling users to perform richer analyses across related data sources.
This was a short summary of some of the features I've worked on over the past month and a half.
Learnings
One of the biggest lessons I've taken away from this project is to invest time in designing systems that make future development easier.
The transformation registry that I designed with my mentor has made adding new transformations significantly simpler. Instead of touching several files every time a new transformation is introduced, the implementation is now largely isolated, making the architecture cleaner and easier to maintain.
The same principle applies to the feature registry. Adding new features and exposing them through the UI now requires much less effort because there is already an established architecture for sidebars, tabs, and workspace components. Instead of every feature introducing its own UI pattern, new functionality naturally fits into the existing workspace.
Another important lesson has been to study similar products and learn from them.
When designing a feature, it helps to understand how other tools solve the same problem and then evaluate whether that approach fits your own product.
A good example is our transformation workflow.
Some transformations are intended only for previewing results, while others should persist changes to the dataset. Microsoft's Data Wrangler addresses this by separating preview mode from apply mode. Users can experiment freely before deciding to commit their changes.
We're planning to adopt a similar workflow by making preview the default mode and introducing an explicit Apply action to persist changes. Looking at existing products doesn't mean copying them. It means understanding the reasoning behind their design decisions and adapting what makes sense for your own users.
The Essence of GSoC
The progress on DataLoom has been incredible, but all of this code and all of these features are not what GSoC is fundamentally about.
GSoC is not a "code for hire" program.
Over the past month and a half, I've also had the opportunity to help onboard a few new contributors to DataLoom. They're now actively participating in discussions on Slack, helping decide what should be built, what shouldn't, and whether we're heading in the right direction.
Seeing two or three new contributors become active members of the community is something I'm genuinely proud of.
The engineering work is real, and I'm happy with what we've built so far, but I think this is the real essence of GSoC: community building.
Seeing discussions happen organically on GitHub issues and Slack, watching new contributors participate in design decisions, and helping build a healthy open source community has been just as rewarding as writing the code itself.
That's what I'll remember most from the first half of this journey.
That's pretty much it.
Thank you so much for reading!